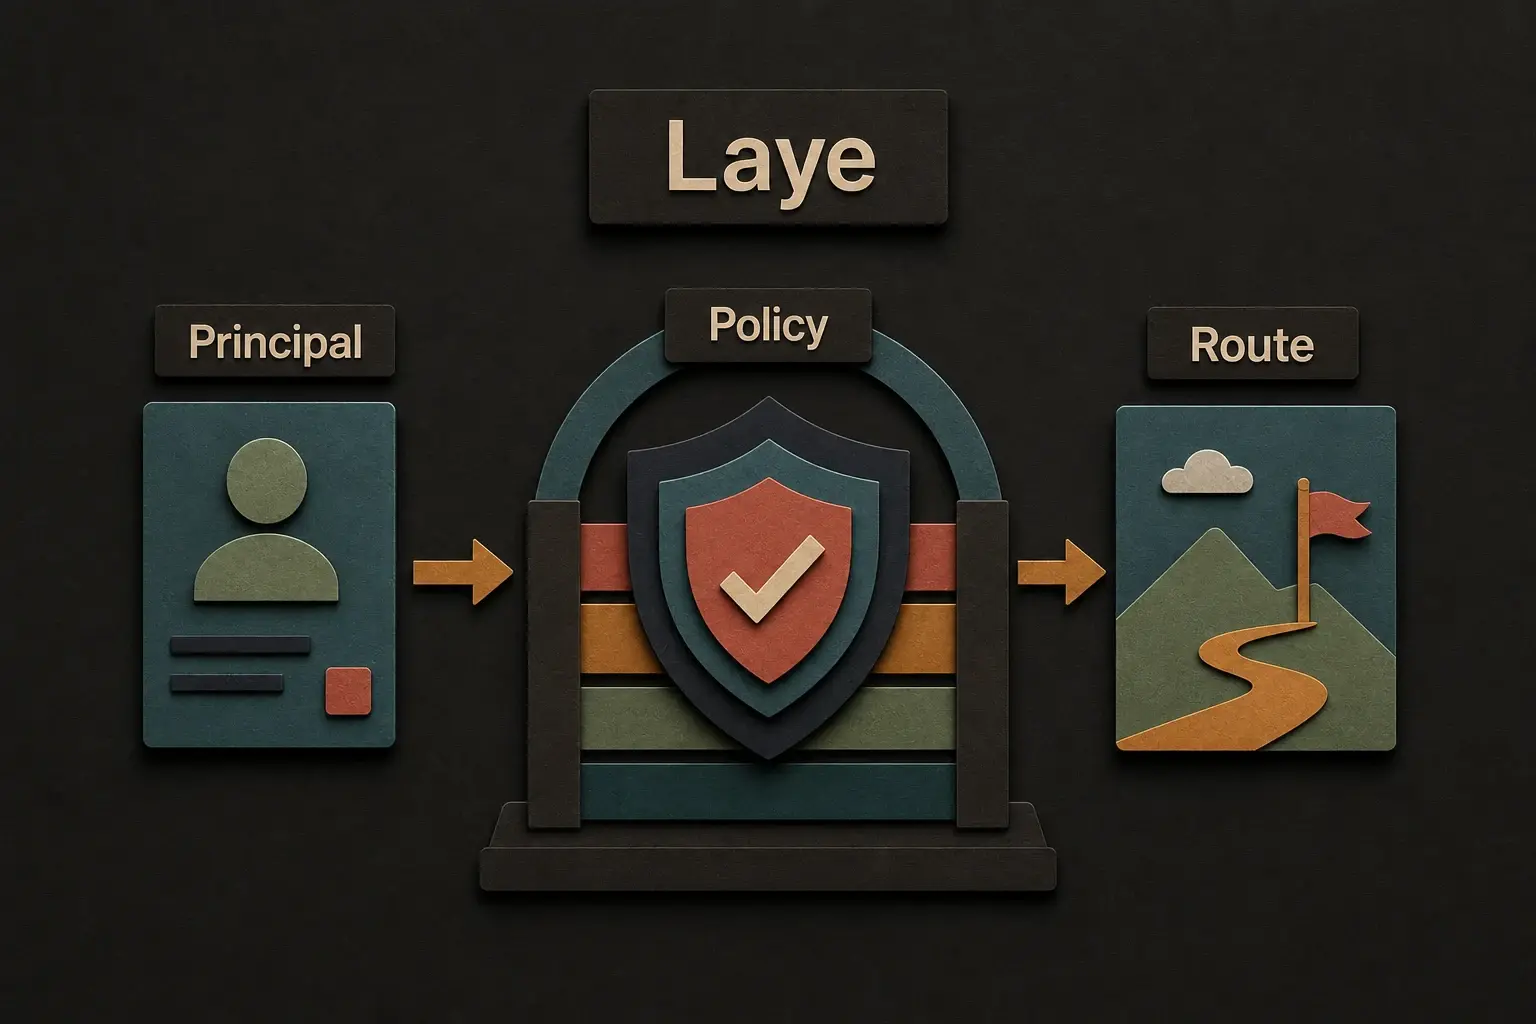
Laye
Framework-agnostic RBAC library for Rust with composable AccessPolicy rules and plug-and-play middleware for actix-web and tower/axum.
RustRBACAccess Control
Celeris Realtime is a public-beta, binary-first WebSocket platform for moving messages across channels, nodes, and regions. I built it in Rust as the sole architect, engineer, and operator, covering the protocol, SDKs, control plane, infrastructure, and observability.
Celeris did not start as a plan to build another realtime platform. It started because I kept running into the same problem from different directions.
While I was building the Payaza Web SDK, the backend engineers were occupied with more pressing launch work, so I built a separate TypeScript, Node.js, and Socket.IO proxy cluster to give the SDK the API and realtime communication it needed. The SDK and proxy worked together: backend services could send payment-status updates through webhooks, and the proxy cluster broadcast those updates to connected clients. I also used consistent hashing so requests for the same connection group would keep returning to the right part of the cluster.
That solved the immediate launch problem, and it worked consistently for the traffic pattern we had. Each client was waiting for a response from one backend, though, so it did not expose the hardest version of the scaling problem. The question of how I would build a cheap, reliable realtime system that I could reuse elsewhere stayed with me.
When I got the opportunity to join HeySummit, part of the attraction was the chance to work on a platform where many people could be communicating in realtime. It was the larger version of the problem I had been thinking about since Payaza.
At HeySummit, one Firebase Realtime Database was handling realtime communication as the company grew to thousands of concurrent users. The server started becoming unstable, and we were reaching the upper limits of the service. My task was simple to describe, even if the implementation was not: make the delivery path scale.
The solution was to use Firestore as the primary datastore and treat Realtime Database instances as realtime delivery servers. We moved selected data to an instance according to its current load and the number of participants on the platform. That gave us a practical way to distribute the work instead of asking one database to carry every connected user.
The system worked, but it did not give us a clean way for the same channel to span multiple realtime servers. Data also existed in two places, which meant routing logic, replication logic, and more failure paths. We solved the scaling problem in front of us, but I still wanted to implement the underlying transport myself and answer what would happen when we needed to scale past that design.
Those two experiences left me with a more specific question: what would a cheap, reliable realtime layer look like if the application database did not have to sit in the middle of every delivery? I wanted an answer I could take with me instead of solving the same problem again at every company.
I was also learning Rust at the time, so I started building the answer with Actix Web, Tokio, Kafka, and Redis. The first version was a serious learning project, but it was also shaped by the business questions I had started paying more attention to: infrastructure cost, reliability, and the experience customers have when systems slow down or fail. In 2026, I began to see it as something I could make public. That is how the project became Celeris Realtime, which is now in public beta. It is also why I have started extracting reusable parts of the work into open-source libraries.
I am the sole architect, engineer, and operator. That means I have worked on the protocol, data model, realtime server, control-plane API, dashboard, SDKs, infrastructure, deployments, observability, tests, documentation, benchmarks, and the smaller open-source libraries that came out of the work.
Celeris is a binary-first WebSocket transport. An application publishes a message, and Celeris moves it to the connected clients that should receive it. It handles connections, authentication, channels, fan-out, presence, ordering boundaries, replay from a short buffer, and delivery across nodes and regions.
It is not the customer's application database, and it is not intended to become one. Celeris does not need to understand an order, payment, chat message, dashboard event, or multiplayer state. It only needs to authenticate the connection, enforce its scope, and move the bytes.
The wire path is binary safe. Clients can publish raw bytes, MessagePack, or Protobuf without converting everything to JSON first. The SDKs provide convenient helpers, but the service remains a normal WebSocket service underneath them. A team can use the JavaScript, Java, Rust, Python, or Flutter SDK, or connect with a raw WebSocket client if that fits better.
That boundary is important to me. An SDK should make the common path easier, not turn a standard protocol into something that only one library can speak.
One thing I could not stop thinking about was how much time realtime systems spend serializing and deserializing data they do not need to understand. If Celeris is moving a payment update, a game event, or a document change, the transport should not need to turn that payload into its own object before sending it to the next connection.
I built a length-prefixed protocol inspired by Redis RESP. The parser reads the command envelope,
uses the declared payload length to find its boundary, and keeps the payload as a bytes::Bytes
slice. It does not inspect or copy the application data just to discover where the message ends.
That is why the parsing time stays close to 0.3 μs as the payload grows in the recorded
Criterion benchmark.
| Payload | serde_json deserialization | Celeris protocol parser |
|---|---|---|
| 128 B | 303 ns | 300 ns |
| 256 B | 313 ns | 305 ns |
| 1 KiB | 2.7 μs | 302 ns |
| 64 KiB | 11 μs | 304 ns |
| 128 KiB | 21 μs | 309 ns |
| 256 KiB | 38 μs | 305 ns |
At 128 KiB, that is about 21 microseconds for serde_json and 309 nanoseconds for the Celeris
parser, roughly 68 times faster in this test. It is not a claim that the two operations have the
same semantics. JSON deserialization validates and materializes the payload, while Celeris
deliberately refuses to understand it. That difference is the point.
The control model starts with an account. An account represents an organisation, and it contains isolated applications. Each application has its own signing credentials, limits, configuration, and usage records.
Connections join channels. A channel is the top-level realtime namespace inside an application, while segments provide smaller rooms within that channel. A collaboration product could use one channel for a document and segments for different types of activity. A commerce product could use one channel for an order and separate segments for payment, fulfilment, and internal operational updates.
The customer's backend signs a short-lived connection payload with the application's signing key. The payload can restrict which channel and segments a client may read from or write to. Celeris can validate that signature without calling the customer's database during the WebSocket handshake.
This does not remove application-level authorization. The customer still decides whether a user should receive a token. It removes that database lookup from Celeris's connection hot path after the decision has already been made.
The simplest delivery path is also the most common one to keep cheap. If the publisher and subscribers are connected to the same Celeris node, the message stays in memory. The channel server writes it into the relevant segment buffer and wakes the local connections that need to read it. Kafka is not involved, and a channel topic is not created just because one node has local subscribers.
The second path appears when the same channel is active on more than one node in a region. Redis stores the presence and coordination data that lets nodes know where a channel is active. Once a second node needs the channel, Celeris creates the regional Kafka topic, subscribes the active nodes, and uses that topic to carry messages between them.
The third path is the same idea across regions. A Celeris node has access to the configured Kafka clusters, but it only publishes a channel message to regions with active subscribers. A region that is configured but has nobody listening to that channel does not receive a copy. This keeps regional isolation as the normal case while still allowing a channel to span the United States and European Union when an application needs it.
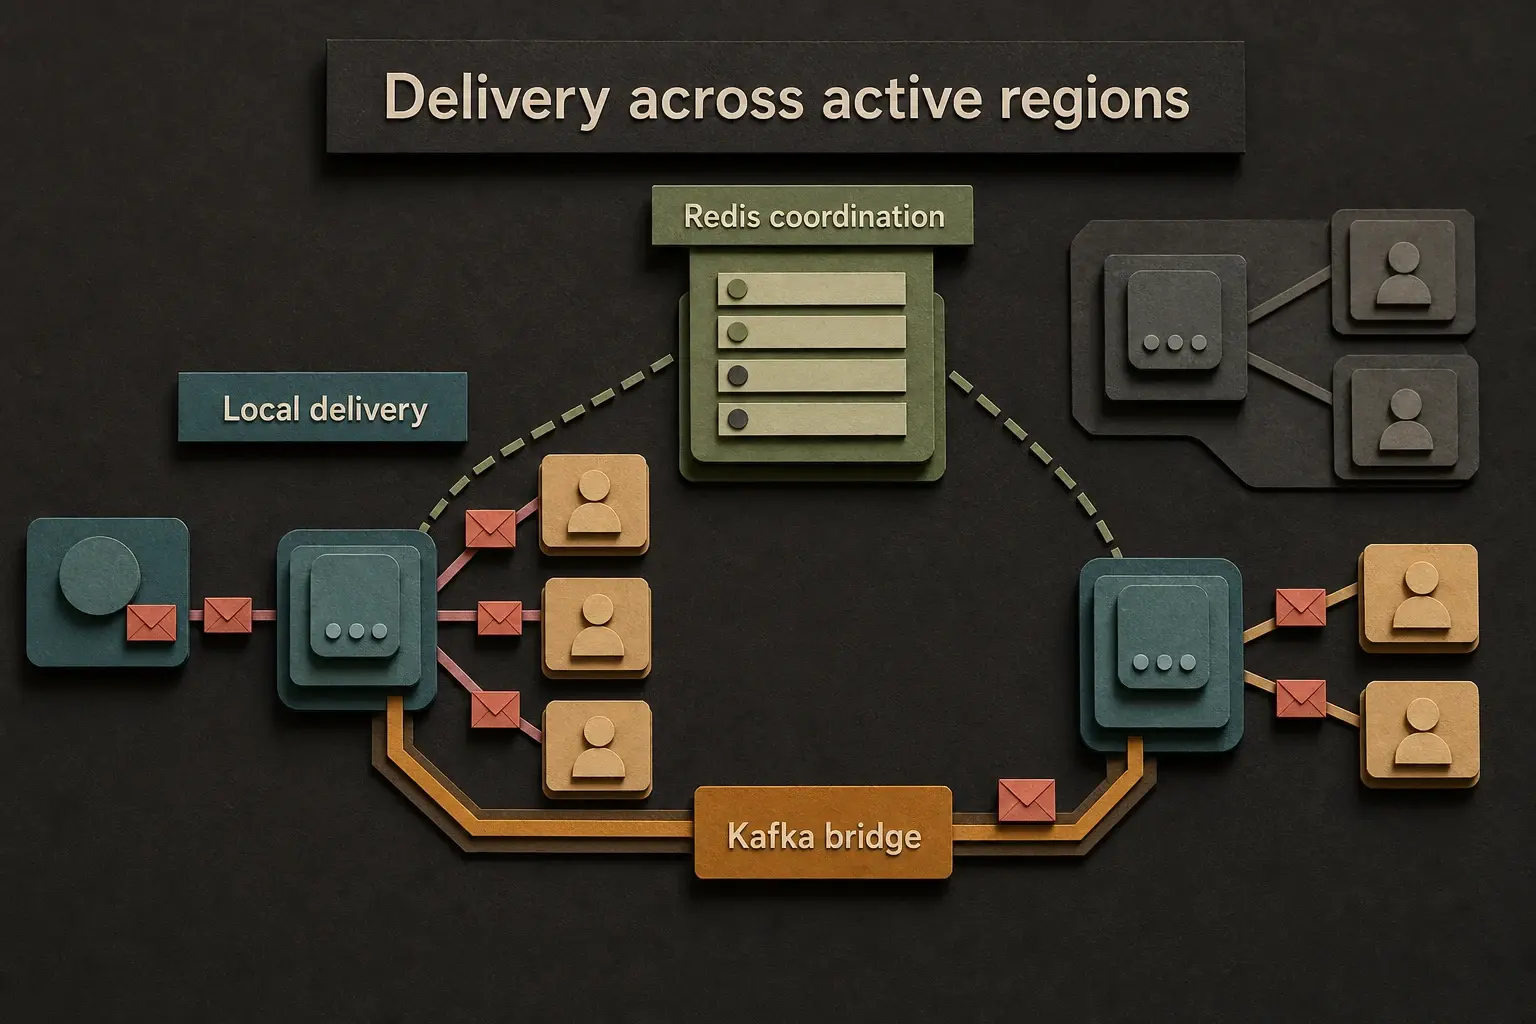
HAProxy sits in front of the realtime nodes and uses the channel reference for consistent routing. Keeping the same channel together makes the local path more likely. The nodes also expose load information used to adjust routing weight from CPU and memory pressure. This is not a promise that a channel can never span nodes. It is a way to avoid paying the distributed path when the local one is enough.
Kafka becomes the message backplane when distribution is actually required, not the first stop for every message.
A shared queue is easy until one connection becomes slow. If the queue only advances when every reader has finished, one faulty phone connection can hold back an otherwise healthy channel.
Celeris handles this by giving each client a pointer into its channel segment's shared buffer. The buffer can keep accepting and serving messages while each connection advances from its own position. Faster clients do not have to wait for the slowest one. Faulty connections are cleaned up separately rather than being allowed to decide the channel's pace.
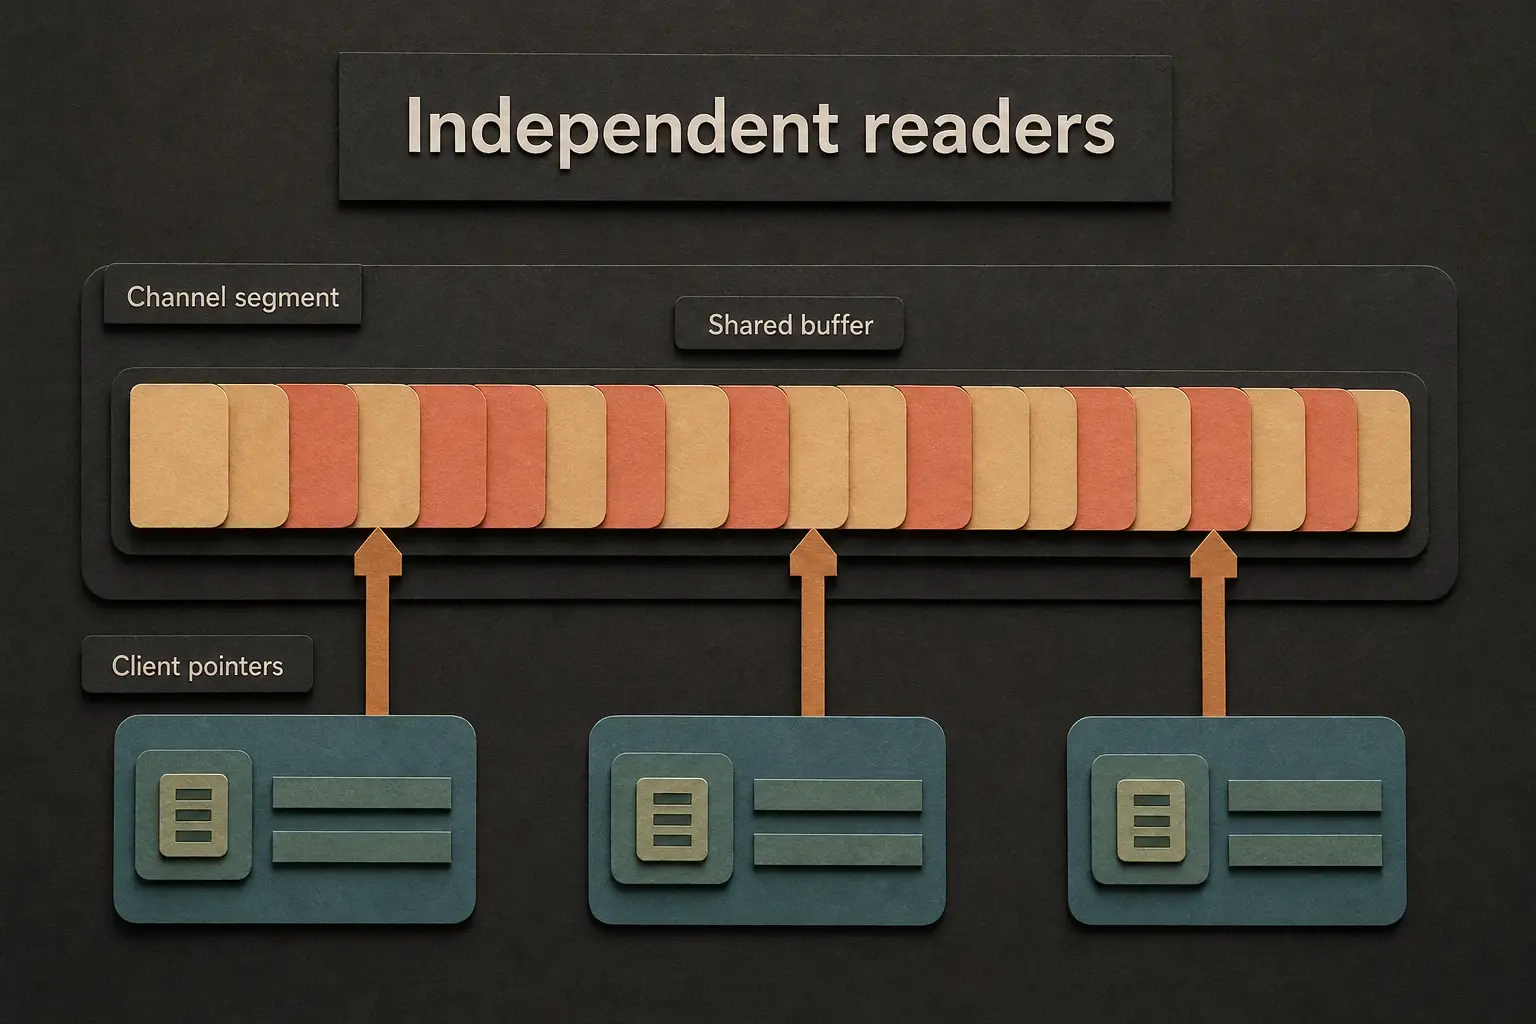
The public product contract keeps up to 100 recent messages for two minutes, including the delivery state needed to serve them. A client can connect without replay, request the available backlog, or request messages within a smaller time window. Replay is opt-in. A client that did not ask for old messages should not receive them simply because another node is catching up.
There are some ordering limits worth stating plainly. Messages remain ordered within a segment on one node, and messages from one origin node keep their order when they move through Kafka to another node or region. If two origin nodes publish concurrently, the relative order between those two streams is best effort. Celeris does not claim a global order that the architecture does not actually establish.
The transition from one active node to several is also at least once. A message published in the small window where another node joins is not meant to disappear, but the normal live path and the backlog relay can both carry it. That means a duplicate is possible during the transition. Message identifiers let consumers handle that case when deduplication matters.
Exactly once would sound neater in a feature list. It would also hide the trade-off I actually made, which was to prefer a possible duplicate over silently losing a message while the topology was changing.
PostgreSQL stores the transactional control-plane data: accounts, plans, applications, signing configuration, limits, and the other records that define how the service should behave. Those records need relational constraints, migrations, and transactional updates.
ClickHouse stores usage history. Message counts, connection minutes, channel minutes, and other time-based measurements have a different access pattern from account configuration. Keeping them separate means the account database does not also have to be the analytics database.
The short realtime buffer is not durable message history. If a customer needs every accepted
message in long-term storage, Bring Your Own Destination connectors can write it to the
customer's Kafka, RabbitMQ, S3, or HTTP endpoint. The export side is at least once and includes an
event_id so the destination can deduplicate retries.
This also keeps Celeris from becoming the owner of data it does not need. The platform handles the spike and delivers the event. The customer's own systems can process and retain it at their pace.
The realtime service is written in Rust with Tokio and Actix Web. The customer-facing dashboard uses Nuxt 4 and Vue 3. I package the services with Docker, publish images to GitHub Container Registry through GitHub Actions, and provision the AWS infrastructure with Terraform.
The regional environment uses Amazon EKS, EC2, ElastiCache for Redis, and Amazon MSK for Kafka. Route 53 and AWS Global Accelerator handle the global entry path. Kubernetes handles service placement and recovery inside a region, while the application still interacts with Redis, Kafka, and PostgreSQL through their normal protocols. I try to use managed services without making the application depend on an AWS-only interface when the standard one is sufficient.
OpenTelemetry instruments the request and message paths. Telemetry flows through Grafana Alloy into Prometheus, Loki, Tempo, and Grafana, giving me metrics, logs, and traces from the same system. For a distributed message path, a single aggregate throughput figure is not enough. I need to see where time was spent, whether one node is doing unusual work, and what happened around a connection or publish failure.
Owning all of this alone makes consistency more important. Infrastructure, application code, dashboards, SDKs, and documentation cannot each describe a different platform and still be operable by one person.
The most complete historical load test I still have ran for 25 minutes with a 0.5 KiB payload on one Celeris node.
| Measurement | Recorded result |
|---|---|
| Throughput | 96,114 messages per second |
| Duration | 25 minutes |
| Payload | 0.5 KiB |
| Celeris node | c8g.large (2 vCPUs, 4 GiB memory) |
| Resource use | 102 MiB memory and 56% CPU |
| Round-trip latency | 32 ms p95, 13.85 ms average, 12 ms median |
| Data transfer | Approximately 44,000 KB/s |
The latency includes the k6 client and load-generator overhead. The more important limitation is that the machine generating the load failed before the Celeris node became stressed. So the 96,114 messages per second result is a sustained tested operating point, not a capacity ceiling.
I expect the real ceiling to be higher because the node still reported 56% CPU and 102 MiB of memory at that point, but expectation is not a measurement. I also lost the rest of the original test documentation, including some of the topology and workload details I would want before making a broader performance claim.
The next benchmark needs a stronger load generator, recorded connection counts, a saved k6 configuration, node and HAProxy topology, regional placement, and archived raw results. Until I run it, the older number stays exactly what it is: the best operating point I can currently defend.
Building the whole platform kept exposing infrastructure code I did not want to write again. Some of those pieces became independent open-source projects.
Trypema began with Celeris pricing tiers. I needed high-throughput rate limiting, but I also wanted the system to suppress traffic progressively as it approached a limit instead of changing from fully open to fully closed in one step. It now provides local, Redis, and hybrid providers as an independently maintained Rust crate.
distkit came from the distributed counters and locks I kept needing around the platform. It includes strict counters for immediate consistency, buffered counters for workloads that can trade some freshness for throughput, instance-aware counters, and Redis-backed distributed mutex and read-write locks.
Laye came from repeating authorization rules across the control-plane and supporting services. It keeps role and permission policies separate from token decoding and database access, then adapts those policies to Actix Web and Tower-based frameworks.
All three are maintained independently. They have their own releases, documentation, tests, and repositories. They are also used in Celeris, which keeps them tied to the real problems that caused me to build them.
That is usually how my more serious open-source work starts. I repeat something enough times, become unhappy with the repetition, and eventually the reusable part gets a repository of its own.
Celeris is in public beta. The platform, dashboard, SDKs, regional infrastructure, observability, and documentation exist, but I am not using that to imply customer adoption, achieved uptime, or commercial scale that I have not recorded.
The next stage is less about adding another long list of features and more about validation: running a better documented benchmark, exercising failure and recovery paths, tightening the public contract, and learning what real applications need once they stop being test clients.
Celeris began with two practical lessons. Realtime delivery should not force the application database onto every message path, and a workaround that succeeds today can still show you the system you will want tomorrow.
Framework-agnostic RBAC library for Rust with composable AccessPolicy rules and plug-and-play middleware for actix-web and tower/axum.
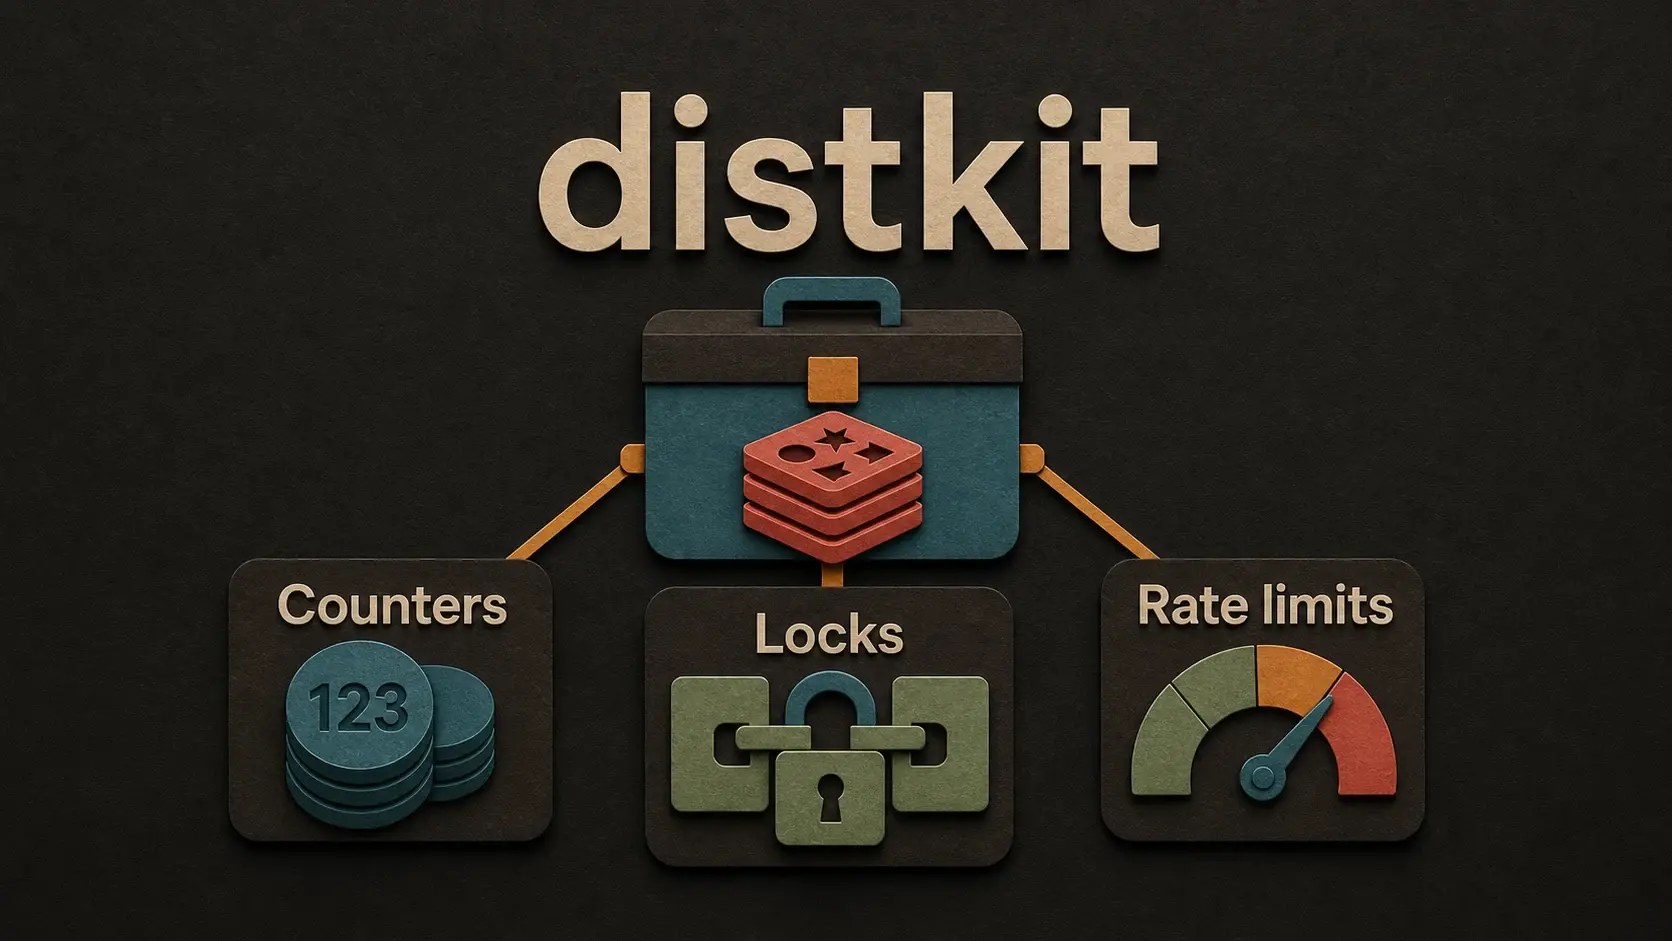
A Rust toolkit of distributed systems primitives backed by Redis. Strict and lax counters, instance-aware counters with automatic dead-instance cleanup, distributed locks (Mutex and RwLock), and sliding-window rate limiting.
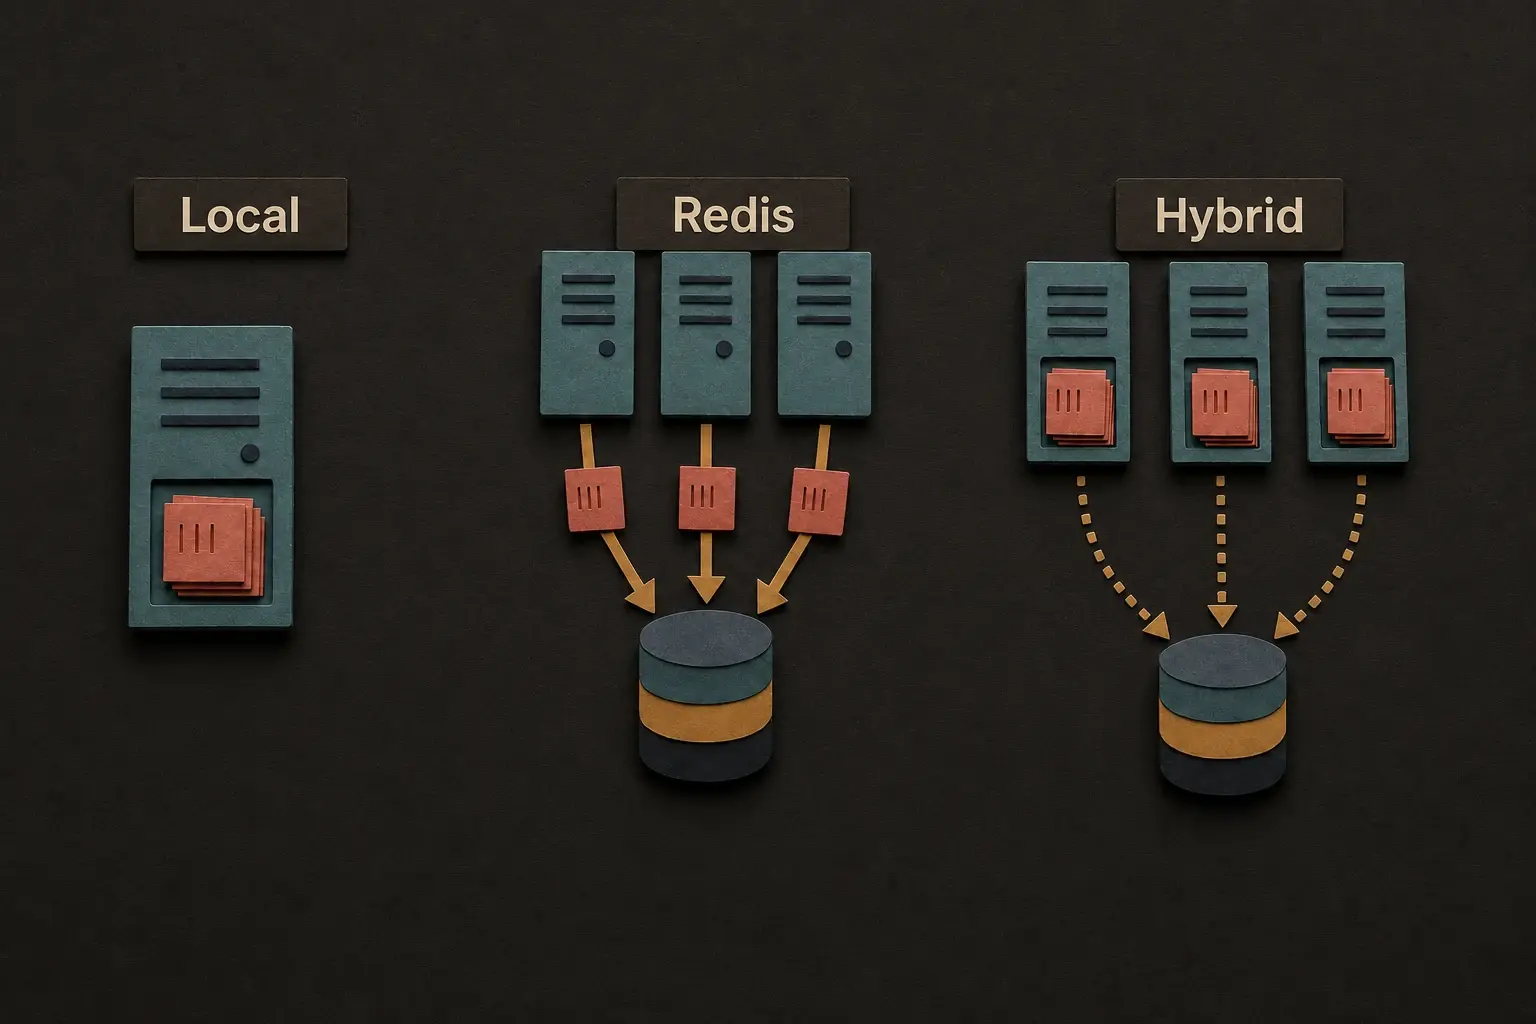
High-performance sliding-window rate limiting for Rust with independently built local, Redis, and hybrid providers.
Available for senior engineering roles, consulting, and architecture reviews.